Sustainable Development Goals (SDG) Health Dashboard
Project Information
- Category: Data Analytics and Visualization
- Client: IE University
- Project Date: January 2023
- Project URL (Part 1): SDG Health Part 1
- Project URL (Part 2): SDG Health Part 2
Project Description
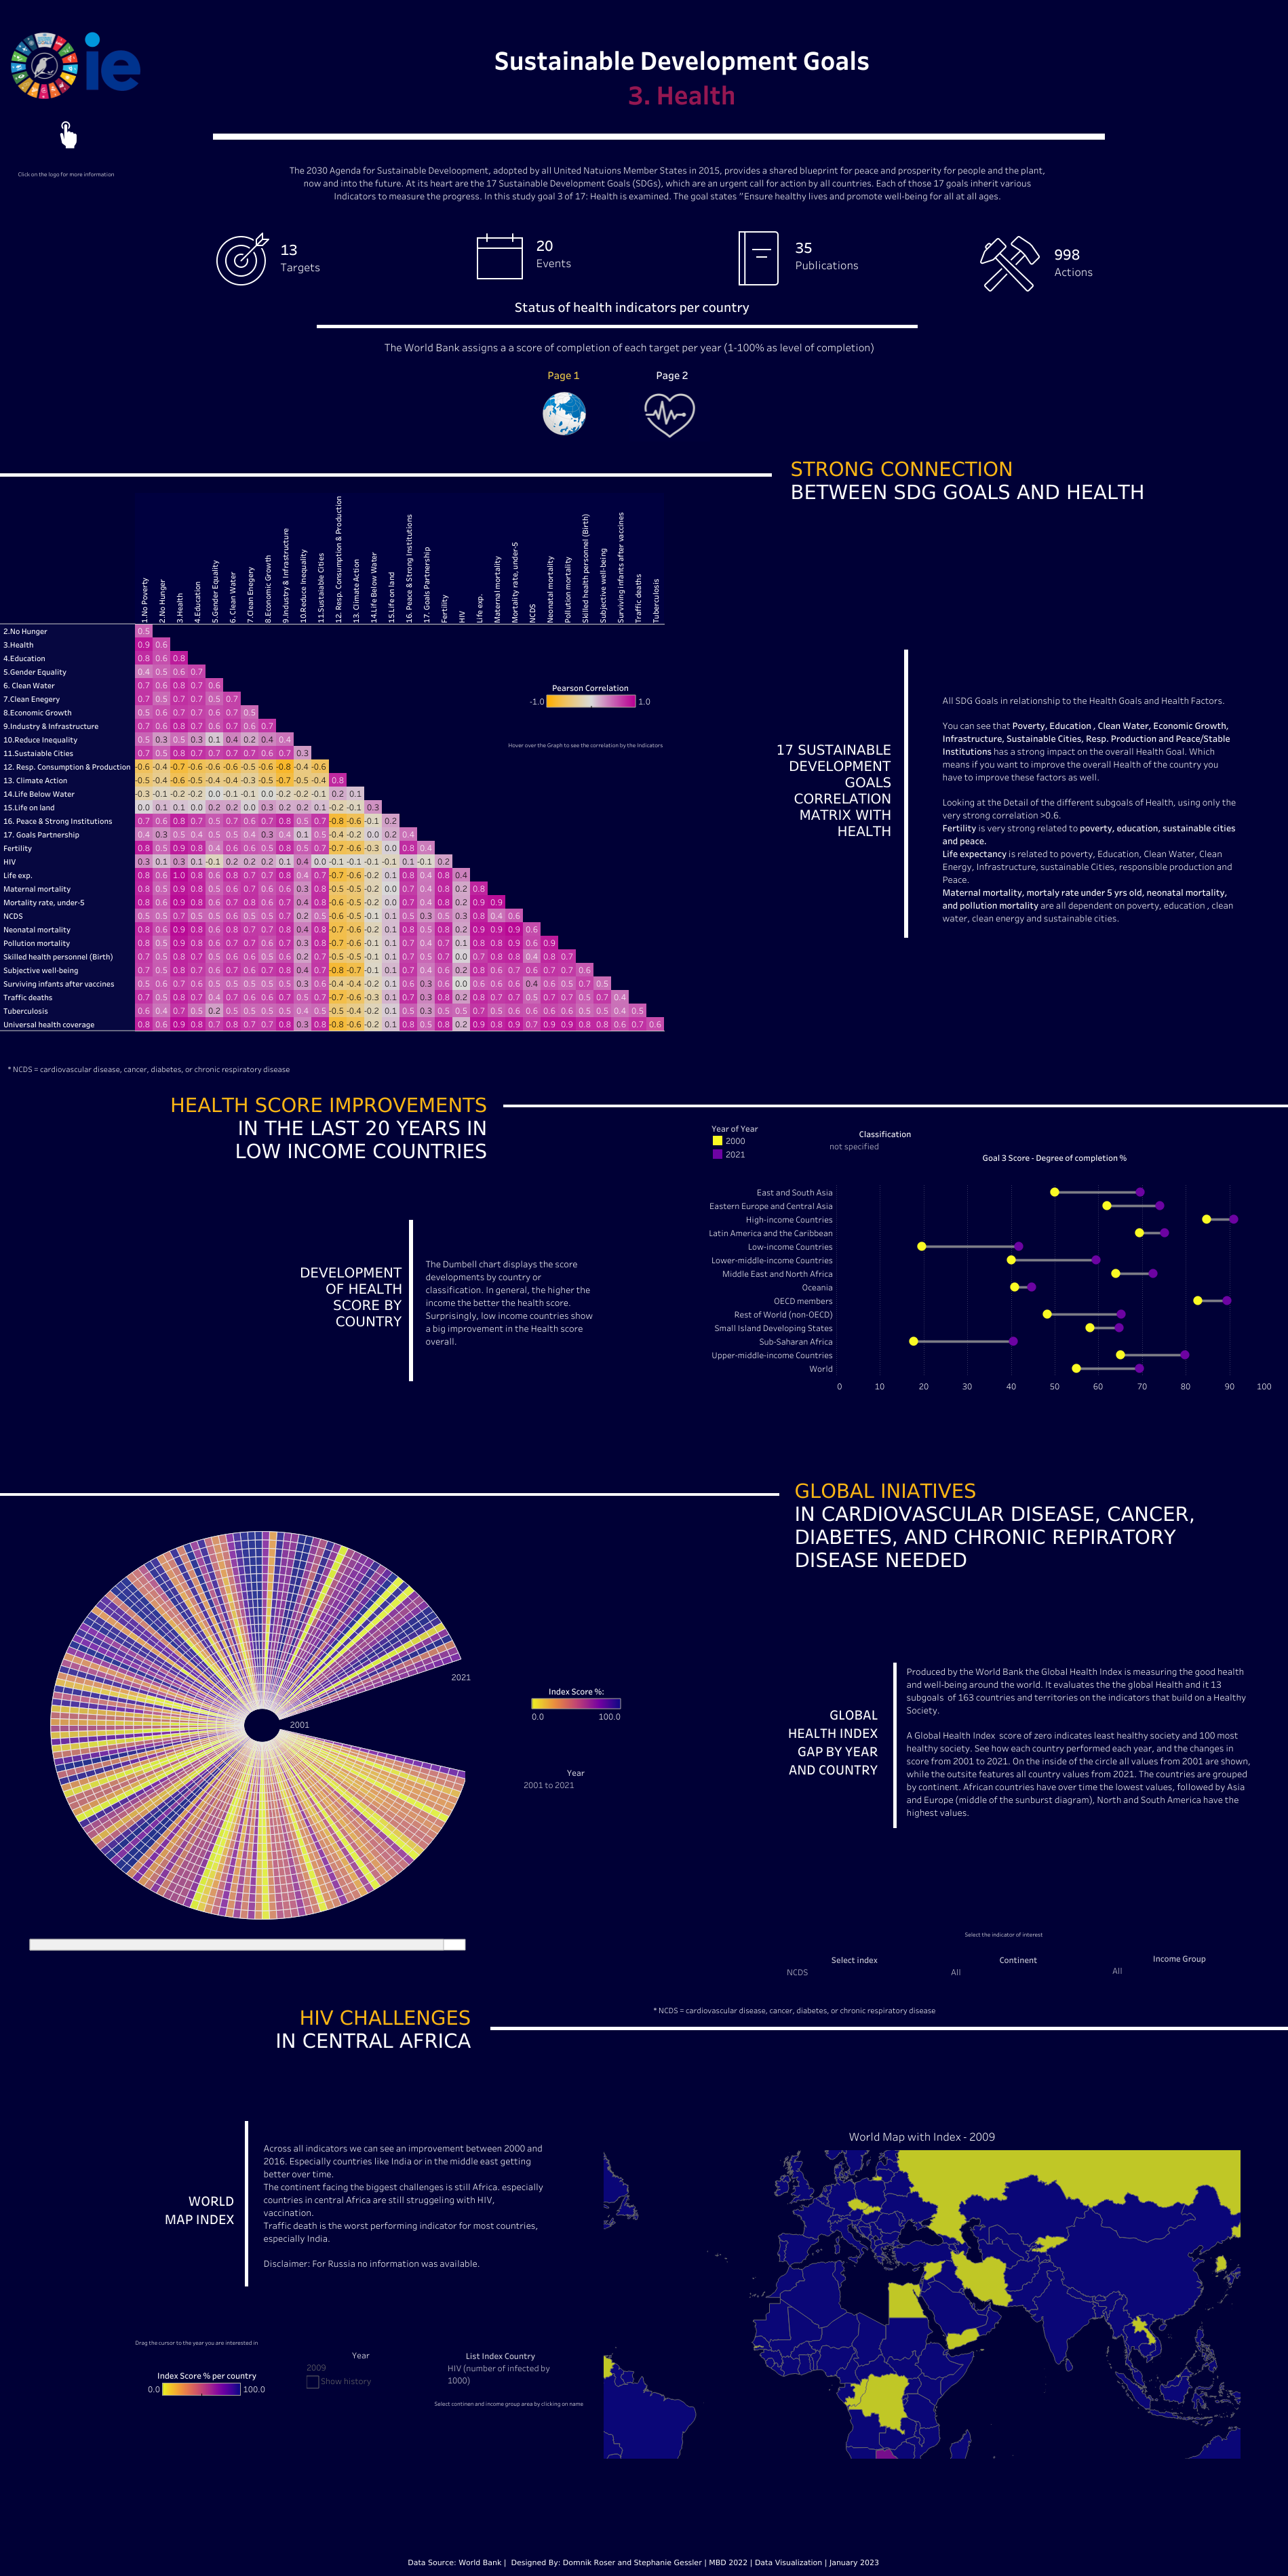
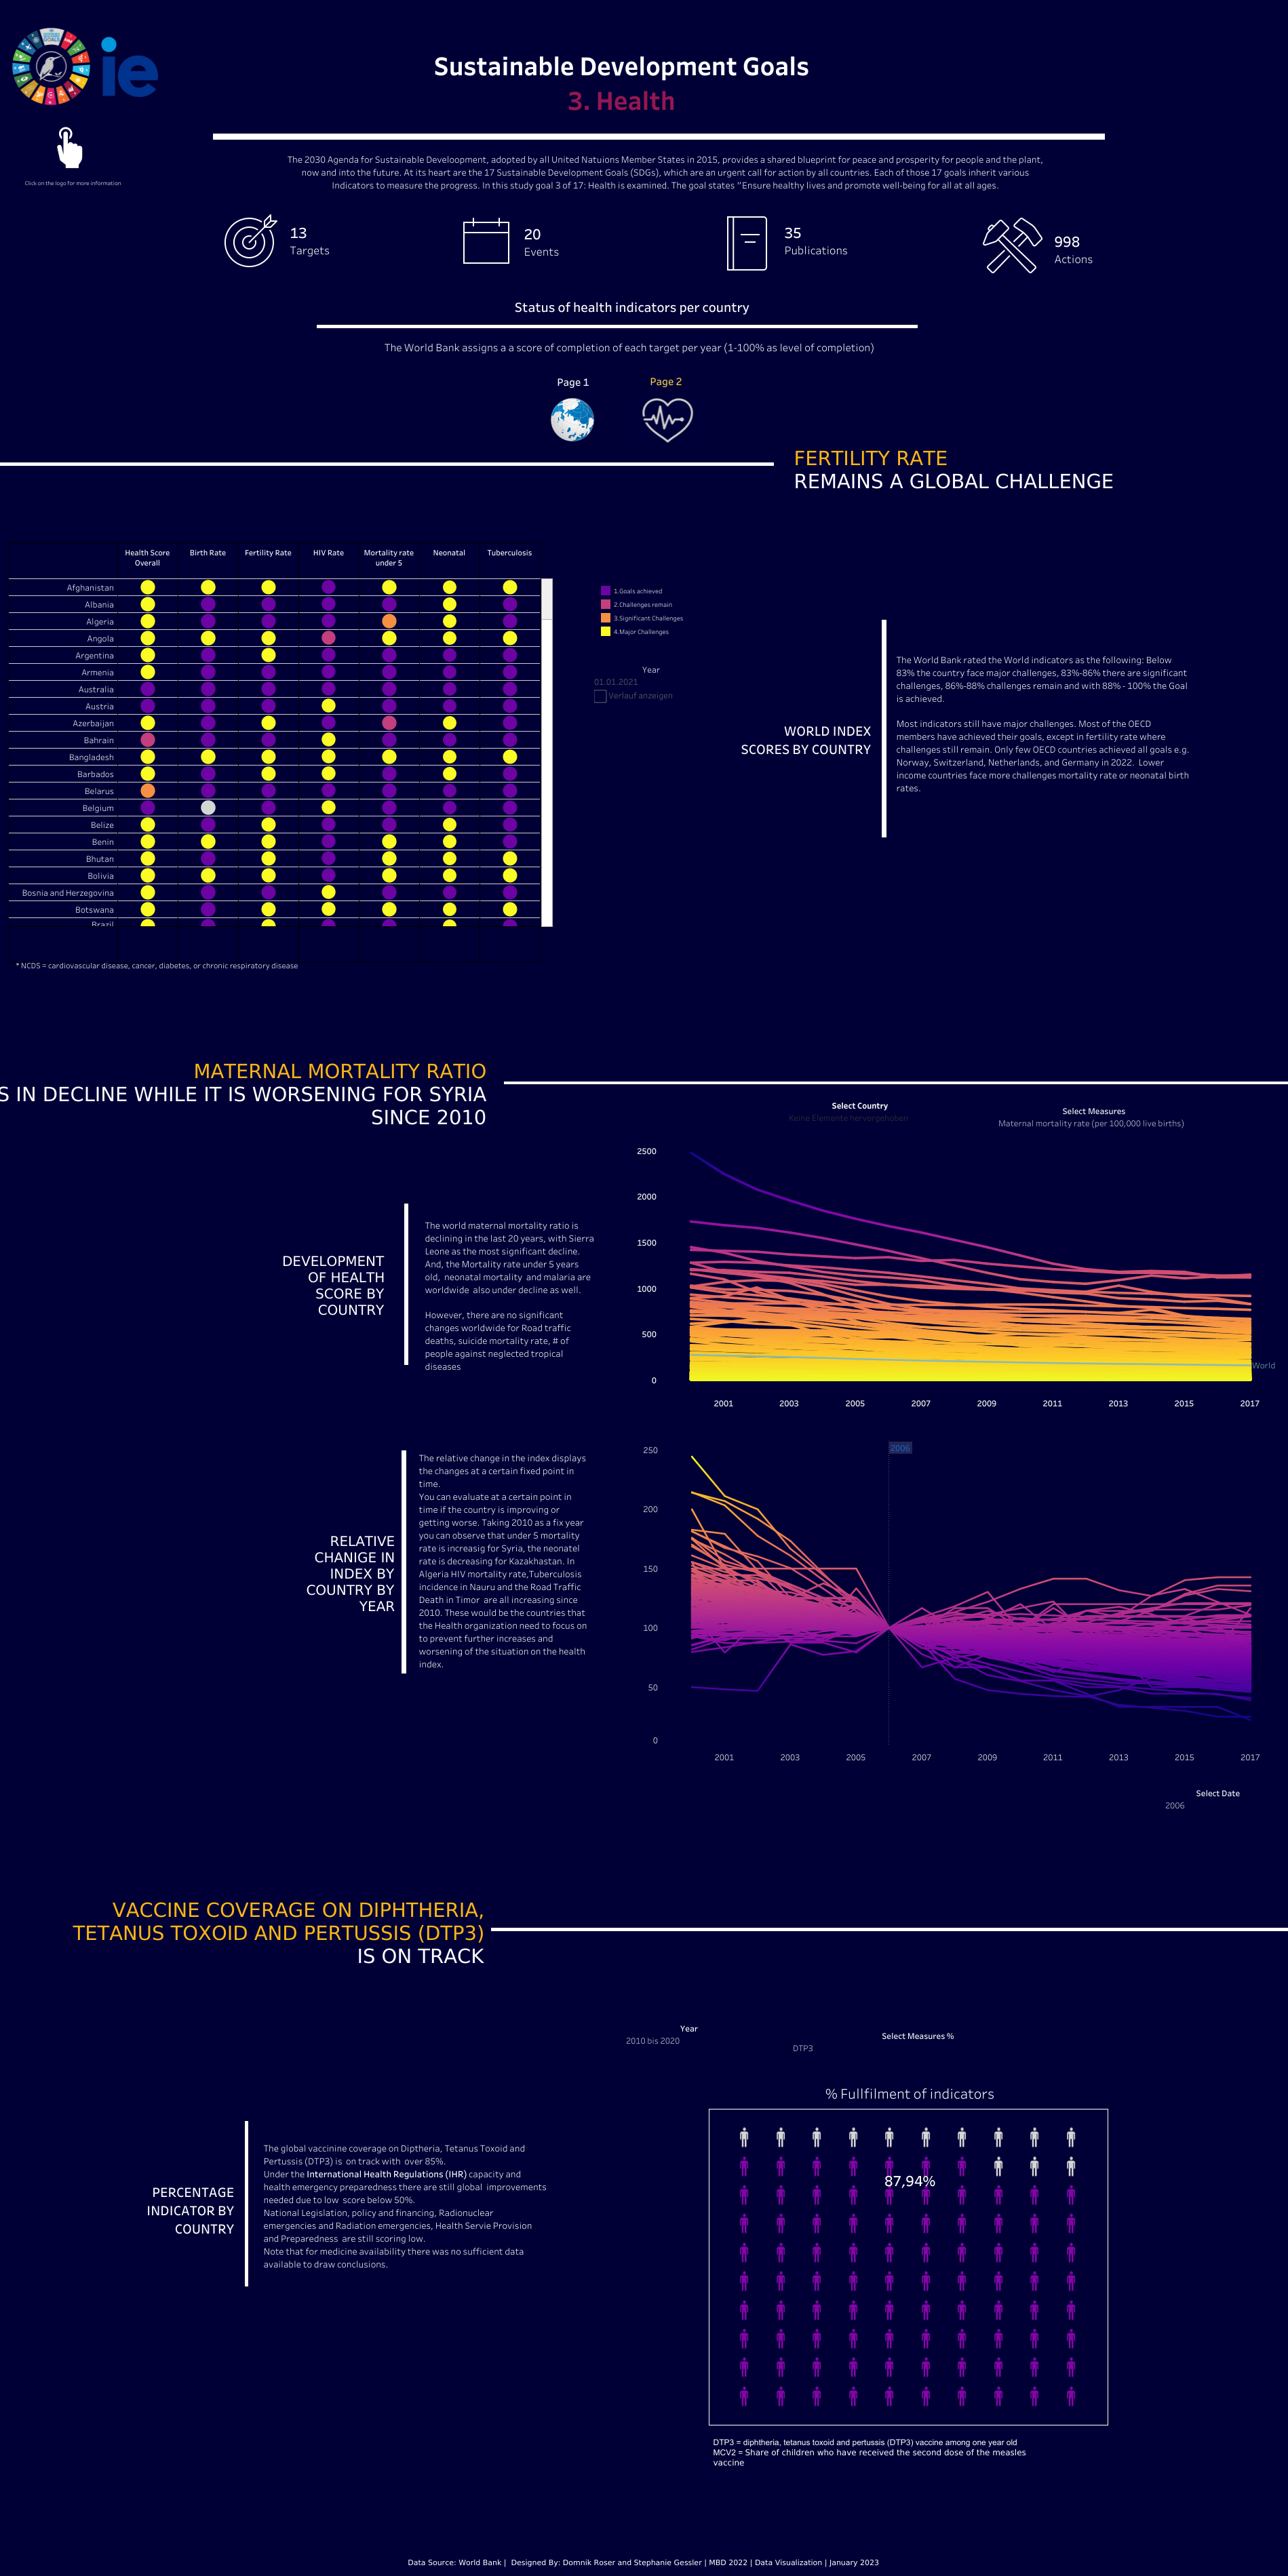
The Sustainable Development Goals (SDG) Health Dashboard project focused on analyzing and visualizing global health data to support the SDGs. Utilizing Tableau, the project created interactive dashboards showcasing key health metrics, including health expenditure, mortality rates, disease prevalence, and healthcare access.
Key Features
- Interactive dashboards showcasing key health metrics related to SDGs
- Visualization of health expenditure, mortality rates, disease prevalence, and healthcare access
- Complex visualizations including heatmaps, time series charts, and comparative bar charts
- Highlighting of health disparities and actionable insights for policymakers
Technical Highlights
- Utilized Tableau for data processing and advanced visualization
- Analyzed data from international health databases to identify critical insights and trends
- Demonstrated expertise in data collection, statistical analysis, and advanced visualization techniques
Impact
This project facilitated informed decision-making to improve global health outcomes by providing policymakers with clear, actionable insights derived from complex health data. The visualizations effectively communicated critical health trends and disparities, supporting efforts to achieve the Sustainable Development Goals in the health sector.